An interactive map, created using data from Resident Advisor, charts the decimation of London’s club scene spanning from 2005 to the present.
The map, which was created in association with London-based innovation firm Nesta, illustrates how many clubs and music venues have closed in the last decade.
“The map reveals that, during this ten-year period, parts of London traditionally known for their nightlife experienced high levels of closures, with a trend of clubbing moving from the West End to the north and east of the city,” says Nesta’s John Davies.
“In the context of the debate around London nightlife the map shows how the location of the city’s clubbing venues has changed and highlights areas that have experienced high closure levels,” Davies continued. “For local authorities and policymakers it raises questions about the future sustainability of culture in city centers, and its connection to the wider creative sector.”
RA and Nesta hope the map will help encourage further discussion and cooperation between London venues and policy makers, aswell as the general public and clubbers.
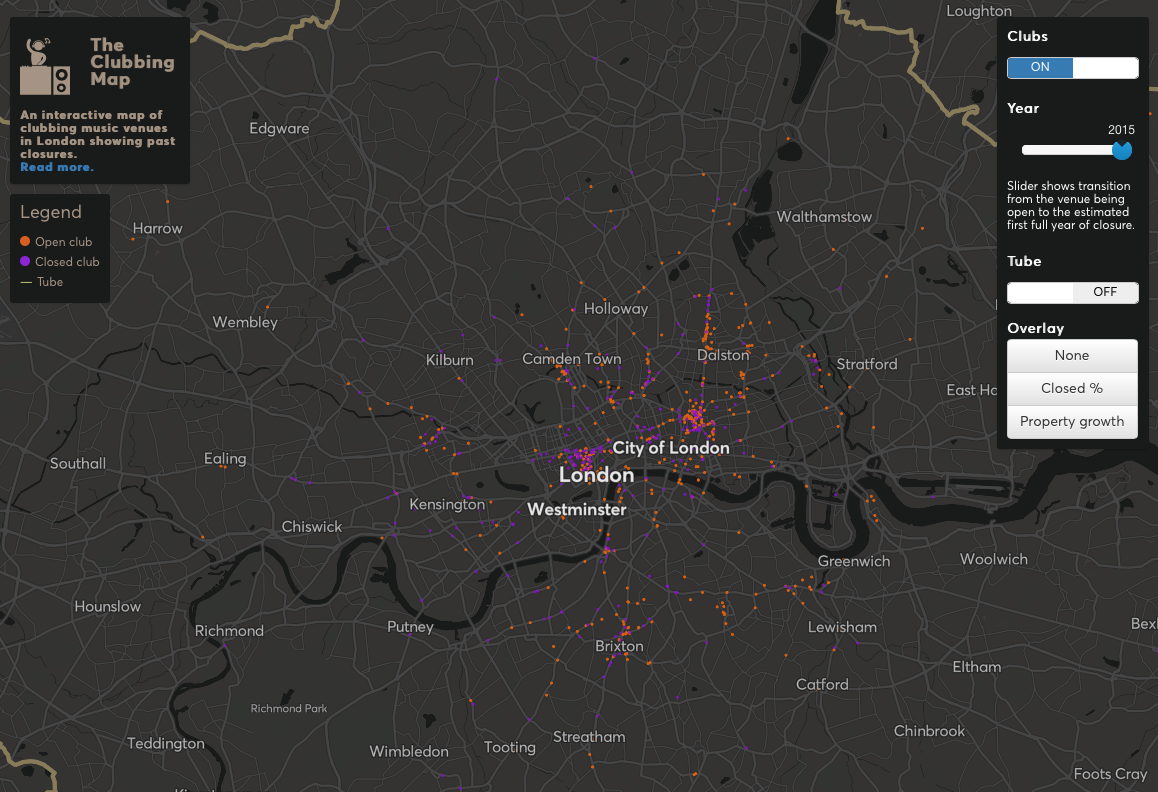
Read Nesta’s full post about the map here. Check out the screenshot of the map below and access the live and interactive version here.